Dashboard
The Dashboard is the first screen you see after logging into the admin panel. It gives you a live, at-a-glance view of your store's performance — revenue, orders, customers, and product activity — without having to run any reports.
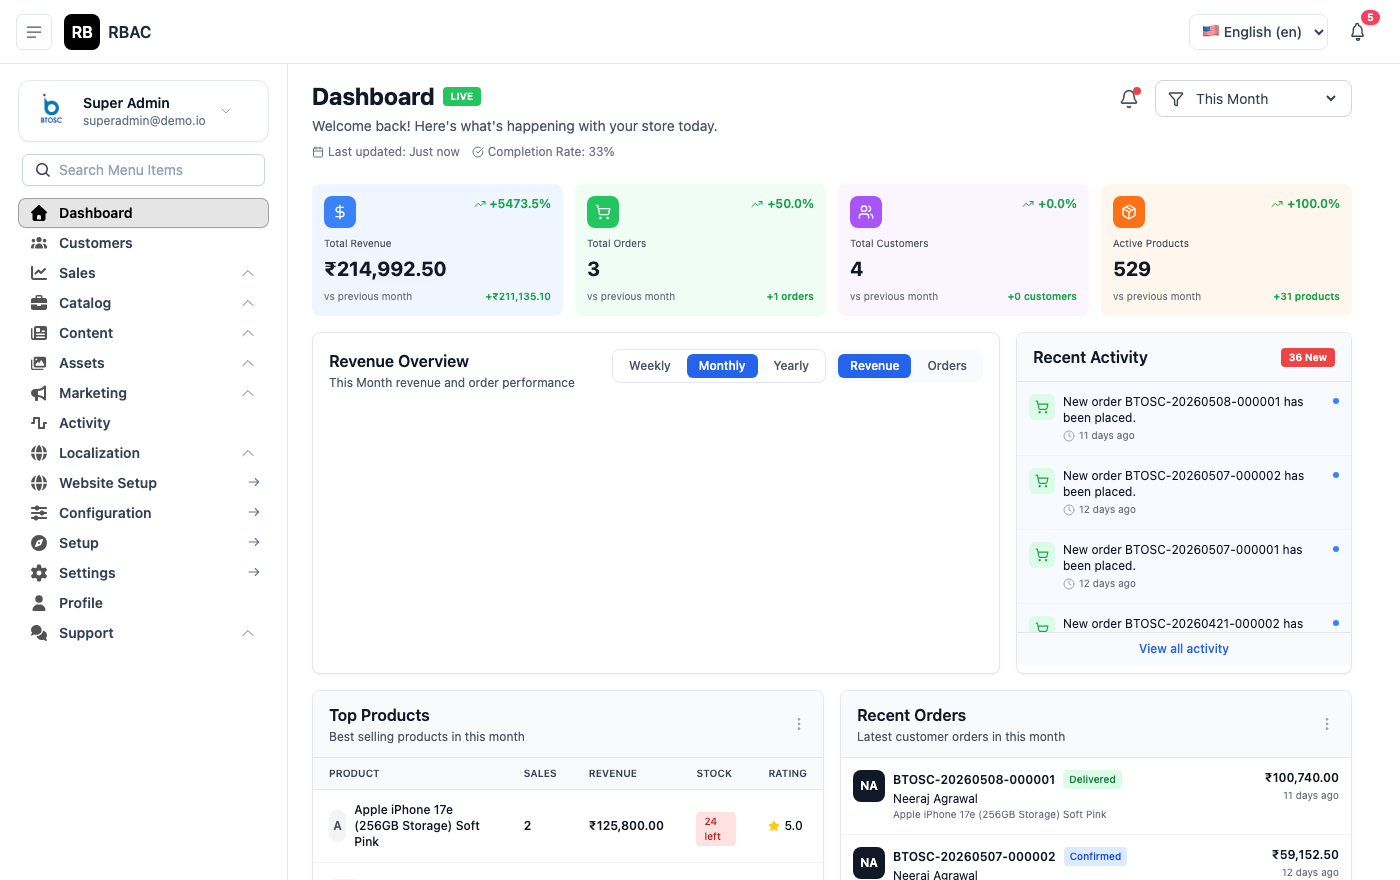 Admin Dashboard showing the four KPI cards, revenue chart, and recent orders table
Accessing the Dashboard
Navigate to /admin and log in. The Dashboard loads automatically. You can also return to it at any time by clicking Dashboard in the left sidebar.
:::info Permission required
Users must have the dashboard.view permission to access the Dashboard. Super Admins always have access.
:::
KPI Summary Cards
The top row of the Dashboard displays four summary cards — one for each of the most critical store metrics. Each card shows the current total and a trend indicator comparing it to the previous period.
Four KPI cards showing Revenue, Orders, Customers, and Products
| Card | What it measures | How it is calculated |
|---|---|---|
| Total Revenue | Gross revenue from completed orders | Sum of grand totals for all orders with status Delivered or Completed |
| Total Orders | All orders ever placed | Count of all orders across every status |
| Total Customers | Registered customer accounts | Count of all active customer records |
| Total Products | Active product listings | Count of products with status Active |
Reading the Trend Indicator
Each card shows a percentage change badge in the bottom-right corner:
- Green arrow ↑ — Metric has increased compared to the previous equivalent period
- Red arrow ↓ — Metric has decreased
- Grey dash — — No change or insufficient data to compare
The comparison period defaults to the previous calendar month.
Revenue Chart
The Revenue Chart provides a visual breakdown of revenue over time.
Revenue chart with date range picker and daily/monthly toggle
Switching Date Ranges
Use the date picker in the top-right corner of the chart to change the time window:
| Option | Shows |
|---|---|
| Last 7 Days | Daily revenue for the past 7 days |
| Last 30 Days | Daily revenue for the past 30 days |
| Last 12 Months | Monthly revenue for the past 12 months |
| Custom Range | You pick the start and end date |
Reading the Chart
- The X-axis shows dates or months depending on the selected range.
- The Y-axis shows revenue in your store's default currency.
- Hover over any point to see the exact revenue figure for that day or month.
- A dashed reference line may appear showing the previous period for comparison.
Orders by Status (Donut Chart)
The donut chart breaks down all orders by their current fulfilment status, so you can see at a glance how many orders are in each stage.
Donut chart showing order distribution across Pending, Processing, Shipped, Delivered, and Cancelled statuses
| Status | Colour | Meaning |
|---|---|---|
| Pending | Yellow | Order placed, payment not yet confirmed |
| Processing | Blue | Payment confirmed, being prepared |
| Shipped | Purple | Dispatched to customer |
| Delivered | Green | Received by customer |
| Cancelled | Red | Order was cancelled |
| Returned | Orange | Customer returned the order |
| Refunded | Grey | Refund has been issued |
Click any segment to jump directly to the Orders list filtered to that status.
Recent Orders
The Recent Orders table lists the latest 10 orders placed in your store.
Recent Orders table showing the most recent 10 orders with status badges
| Column | Description |
|---|---|
| Order # | Unique order number — click to open the full order detail |
| Customer | Customer name and email |
| Items | Number of line items in the order |
| Total | Grand total including shipping and tax |
| Status | Colour-coded status badge |
| Date | Order placement date and time |
Click View All Orders at the bottom of the table to go to the full Orders list.
Top-Selling Products
The Top Products table shows your best-performing products ranked by units sold in the selected date period.
Top Selling Products table showing product image, name, category, and units sold
| Column | Description |
|---|---|
| Product | Thumbnail image and product name |
| Category | The category this product belongs to |
| Units Sold | Total quantity sold in the selected period |
| Revenue | Revenue generated by this product |
This table uses the same date range as the Revenue Chart. Changing the chart date range also updates the Top Products data.
Recent Customers
A list of the 5 most recently registered customer accounts, showing their name, email, and registration date.
Click any customer row to open their profile in the Customers section.
Low Stock Alerts
If any product's stock quantity falls below its configured Low Stock Threshold, it appears in the Low Stock Alerts panel on the Dashboard.
Low Stock Alerts panel listing products that need restocking
| Column | Description |
|---|---|
| Product | Product name and variant (if applicable) |
| Current Stock | Number of units remaining |
| Threshold | The quantity at which the alert was triggered |
Click a product name to go directly to its edit form and update the stock quantity.
:::tip Set thresholds proactively Configure Low Stock Thresholds on every product during initial setup. Go to Products → Edit → Inventory and set a threshold appropriate to your reorder lead time. A threshold of 5–10 units is a good starting point for most stores. :::
Refreshing the Dashboard
The Dashboard data is fetched fresh each time you load or navigate to it. To manually refresh, press F5 or click the browser refresh button. The data does not auto-refresh while you are on the page.
Permissions
| Action | Required Permission |
|---|---|
| View Dashboard | dashboard.view |
Users without this permission will not see the Dashboard in their sidebar and will be redirected if they try to access /admin/dashboard directly.